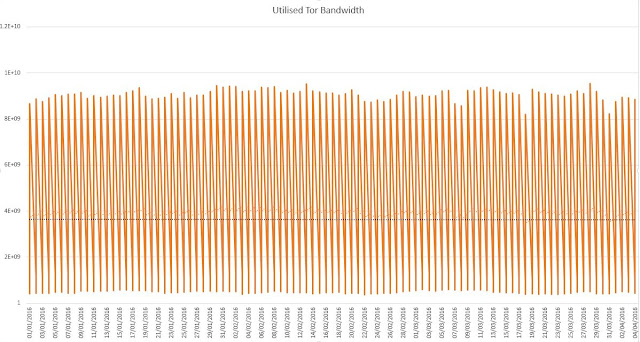
The question then occurs as to whether the overall traffic on Tor has seen a similar fall. The short answer is no:
The overall usage of Tor varies a lot during any one day but if you take a simple moving average through the data (black line) you can see that there has been no decrease similar to that seen for hidden services traffic. As discussed previously one has to remember that hidden services traffic is only a tiny fraction of the overall Tor traffic, so it may be that a change, even a dramatic change, in the hidden services traffic would not show up in the overall traffic volumes. But what one can say is that the hidden services traffic is not simply a result of some overall drop in usage of Tor in general.
So we have another mystery. Hidden services traffic has dropped with no drop in the number of .onion addresses and no suggestion that Tor as a whole is being deserted.
If anyone has any ideas I'd love to hear them - see me on Twitter at @profwoodward.
UPDATE 09/04/2016: The volume of data traffic to hidden serbices continues to fall and is now less than 50% of what it was only a week ago:


